GEOTECHNICALENGINEERING
KAMLOOPS
HomeGeophysicsSeismic tomography (refraction/reflection)

Seismic Tomography (Refraction/Reflection) in Kamloops

Practical geotechnics, field-tested.

LEARN MORE

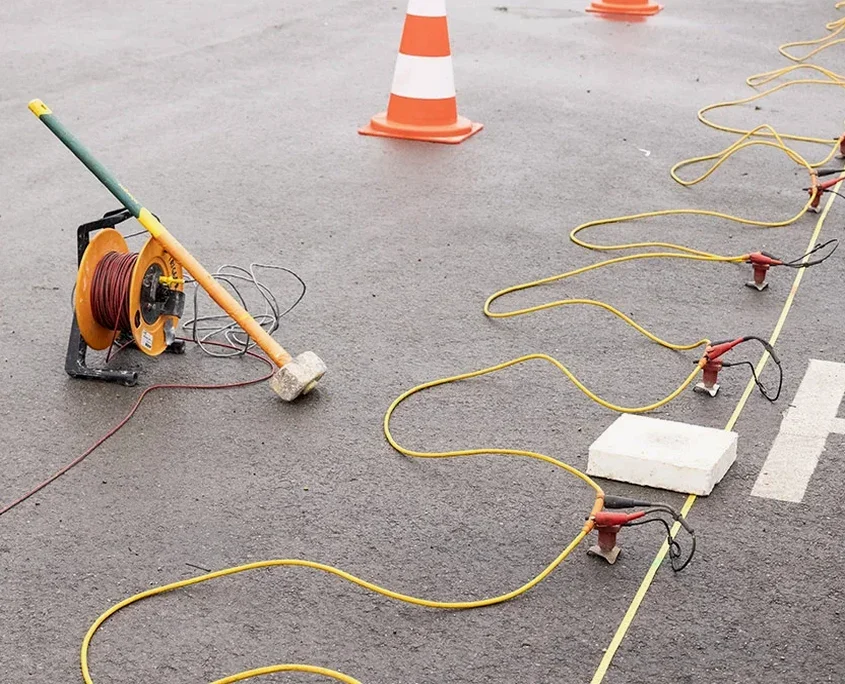
The geophone spread goes in first—usually 24 or 48 channels on a 3-meter spacing—and the trigger cable runs back to a 24-bit seismograph that’s been calibrated to factory specs the night before. In Kamloops we’re dealing with a dry, high-desert surface layer that kills signal fast, so the source has to be chosen carefully. A 10-kg sledge on an aluminum plate works for shallow targets under 15 m, but once the overburden thickens past the Thompson River terraces we switch to a Betsy seisgun or an accelerated weight drop that puts enough energy into the glacial till to return a clean first-break at 60 m plus. The crew sets up the line, hammers in the geophones, and takes a noise check before the sun hits the slope and traffic on the Trans-Canada starts masking arrivals. Calibration shots confirm trigger zero-time, and then the profile runs end-to-end in half an hour. Refraction processing picks first arrivals on every trace; the time-distance curves get inverted through a tomographic algorithm that produces a true 2-D velocity section, not a layered approximation. When the job demands deeper resolution—say a bedrock depression under a proposed foundation or a fault scarp hidden by colluvium—we run a reflection spread with a common-midpoint stack that images impedance contrasts down to 100 m. In the Valleyview benchlands a recent MASW survey confirmed a shear-wave velocity reversal at 12 m that the refraction alone had missed, so the combined approach became standard for any site where fill overlies native silt.

First-break picks on a 48-channel spread tell you more about Kamloops’s buried topography than a dozen boreholes drilled blind.

Our service areas

How we work

NBCC 2020 clauses on seismic site classification (Table 4.1.8.4.A) require a measured Vs30 unless the site fits a default class, and Kamloops’s variable drift thickness makes defaults unreliable. A refraction line that captures P-wave velocity in the top 30 m, then converts it to Vs through a Poisson’s ratio of 0.35–0.40 for the local silt, gives the engineer a defensible class C or D boundary. CSA A23.3 references the same table for concrete structures, so a single tomographic line feeds both the geotechnical report and the structural design package. The equipment chain matters: a Geometrics Geode with 24-bit A/D and a 0.125 ms sample interval resolves layers as thin as 1.5 m when the velocity contrast exceeds 400 m/s. For reflection work we add a downhole trigger and a hydrophone string in flooded boreholes where groundwater is within 3 m of surface—common along the South Thompson floodplain. The processing workflow runs from geometry assignment through automatic gain control, bandpass filtering, velocity analysis, and NMO correction, producing a stacked section that looks like a mini-seismic line from an oil patch. When the target is rippability, the Caterpillar D8R chart plots seismic velocity against fracture spacing; a velocity above 2,200 m/s in the Kamloops Group volcanics usually means a hydraulic hammer instead of a ripper tooth. A seismic-refraction line combined with a test-pits log at the midpoint ties the velocity boundary to a visible lithological contact, so the cross-section isn’t just a color contour—it’s a logged geologic profile.
Seismic Tomography (Refraction/Reflection) in Kamloops
Technical reference — Kamloops

Site-specific factors

The single mistake we see repeatedly in Kamloops is a developer ordering a refraction line, getting a clean-looking velocity section, and then pouring a footing on a high-velocity layer that turns out to be a dry, overconsolidated silt cap—not bedrock. The velocity contrast looks convincing on the tomogram because the silt can hit 1,800 m/s when it’s desiccated, right in the range of a weathered shale. But the refusal is false: a few metres of excavation or a wet spring and the material collapses into a soft native clay that was masked by the cap. The fix is a single CPT test pushed through the suspect horizon, correlating tip resistance with the seismic velocity. Another failure mode is mistaking a reflection multiple for a real bedrock reflector in the valley fill north of the river; a stacked section without a velocity semblance analysis can show a convincing event at 45 m that’s actually a water-layer peg-leg. We run a check shot or a downhole survey in a cased borehole to calibrate the reflection time-depth curve whenever the section will govern pile tip elevations. Skipping that calibration has led to piles terminated 8 m above actual rock, caught only when a footings inspection found settlement before the superstructure was framed.

Need a geotechnical assessment?

Reply within 24h.

Email: info@geotechnicalengineering.vip

Video overview

Regulatory framework

NBCC 2020 (National Building Code of Canada) – seismic site classification, CSA A23.3 – design of concrete structures, seismic provisions, ASTM D5777 – standard guide for seismic refraction

Technical parameters

ParameterTypical value
Maximum refraction depth (sledge source)15–20 m
Maximum refraction depth (accelerated weight drop)60–80 m
Maximum reflection depth (CMP stack)100+ m
Typical geophone spacing2–5 m
Sample interval0.125 ms
P-wave velocity range in Kamloops till600–1,800 m/s
Riipability threshold (volcanic bedrock)2,200 m/s

Frequently asked questions

How deep can seismic refraction see in Kamloops’s dry surface conditions?

With a sledgehammer source, 15–20 m is typical in the dry silt and sand that cover much of the city. An accelerated weight drop or Betsy seisgun extends that to 60–80 m, depending on the noise environment. Reflection profiling with a downhole source can reach 100 m or more when the water table is within a few metres of surface.

What does a seismic tomography survey cost in the Kamloops area?

A single 24-channel refraction line with tomographic processing typically runs between CA$4,160 and CA$8,180, depending on line length, source type, and access difficulty. A combined refraction-plus-MASW spread or a reflection line with CMP stacking will be at the upper end of that range or slightly beyond.

Can you determine rippability from refraction data?

Yes—the Caterpillar rippability chart plots seismic P-wave velocity against fracture spacing and rock type. In the Kamloops Group volcanics and the underlying Cache Creek complex, velocities above 2,200 m/s generally indicate that a hydraulic hammer will be needed instead of a ripper tooth. We include a rippability map layer with every bedrock refraction deliverable.

Do I need a borehole to calibrate the seismic velocities?

The reference range for this service in Kamloops is CA$4.160 - CA$8.180. The final price depends on the project scope and volume.

Location and service area

We serve projects in Kamloops and surrounding areas.

View larger map